Defining Stress and Strain in Structural Metals
In the formal language of solid mechanics, stress is defined as the internal force per unit area within a material resisting an external applied load, expressed in pascals (Pa) or megapascals (MPa). Strain is the dimensionless ratio of dimensional change to original dimension — the fractional elongation, compression, or shear that results from the applied stress. The relationship between these two quantities, as expressed in the constitutive equations of continuum mechanics, governs the entire deformation behaviour of metallic engineering materials.
Three principal modes of stress act upon metallic bodies: tensile stress, which tends to elongate the material; compressive stress, which tends to shorten it; and shear stress, which tends to cause relative sliding between parallel planes within the material. In real-world structural scenarios, components are rarely subjected to a single pure stress mode. Instead, complex three-dimensional stress states arise in which all three modes act simultaneously with varying magnitudes in different orientations. The analysis of these multiaxial stress states is the domain of advanced structural mechanics and requires mathematical tools beyond simple scalar equations.
Principal Stresses and the Mohr Circle
For any point within a stressed body, it is always possible to identify a specific coordinate system — the principal stress system — in which all shear stresses vanish and the stress state is fully described by three normal stresses: σ1, σ2, and σ3, known as the principal stresses. The largest principal stress governs tensile failure modes; the largest shear stress — equal to (σ1 − σ3)/2 — governs yielding according to the Tresca yield criterion.
The Mohr circle, a graphical representation of stress transformation first developed by Otto Mohr in 1882, provides an elegant method for visualising the variation of normal and shear stress as the coordinate system is rotated about any axis. In materials engineering practice, Mohr circle analysis is employed to identify the orientation of maximum shear stress planes — the planes along which plastic deformation will first initiate — and to calculate principal stress magnitudes from measured strain gauge data. Modern finite element analysis software performs these calculations computationally for every element in a mesh, but the underlying geometric principles of Mohr's formulation remain foundational to the engineer's conceptual understanding of stress states.
Stress Concentration and Geometric Discontinuities
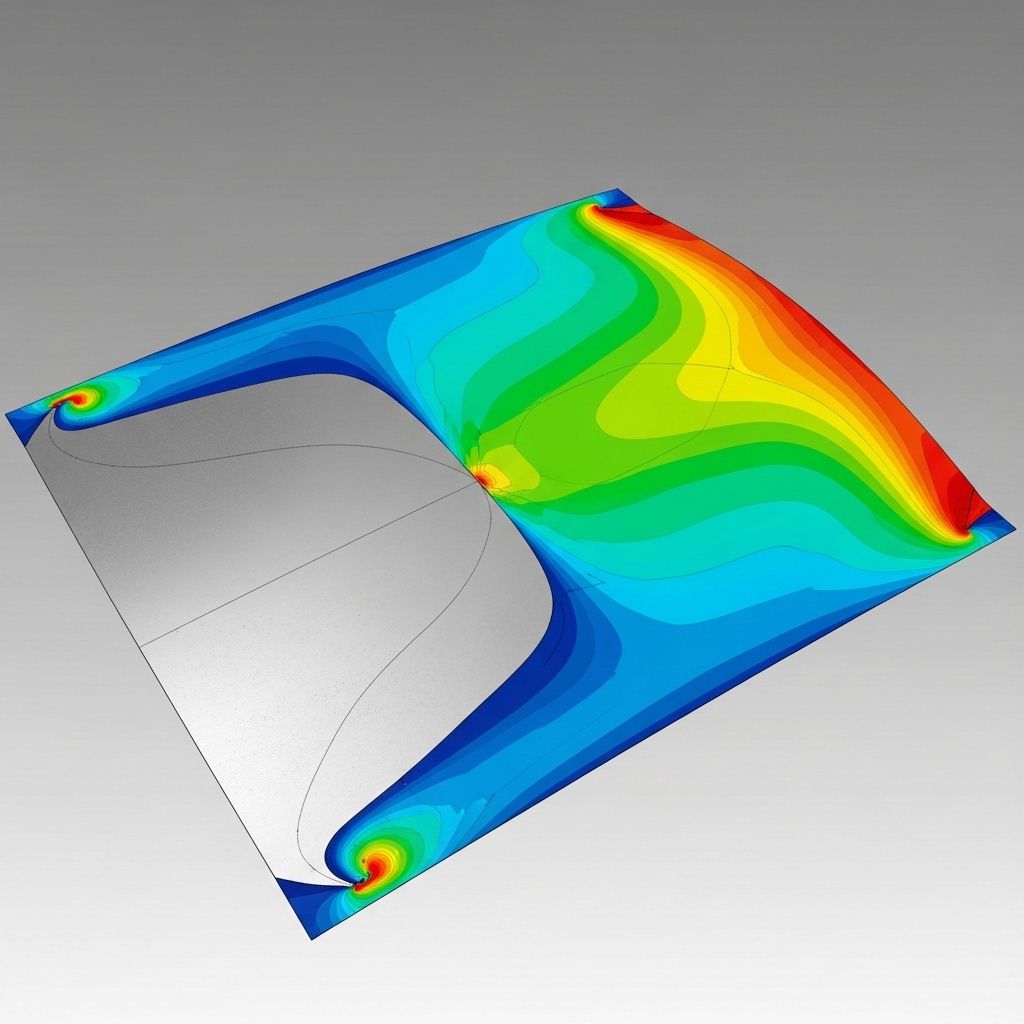
The assumption of uniform stress distribution — that the applied load divides equally across the resisting cross-sectional area — holds only for simple prismatic members under axial loading. In the presence of geometric discontinuities such as holes, fillets, notches, welds, or abrupt changes in section thickness, local stress concentrations develop in which the actual stress significantly exceeds the nominal (average) stress value. This elevation is quantified by the stress concentration factor Kt, defined as the ratio of maximum local stress to nominal stress: Kt = σmax / σnom.
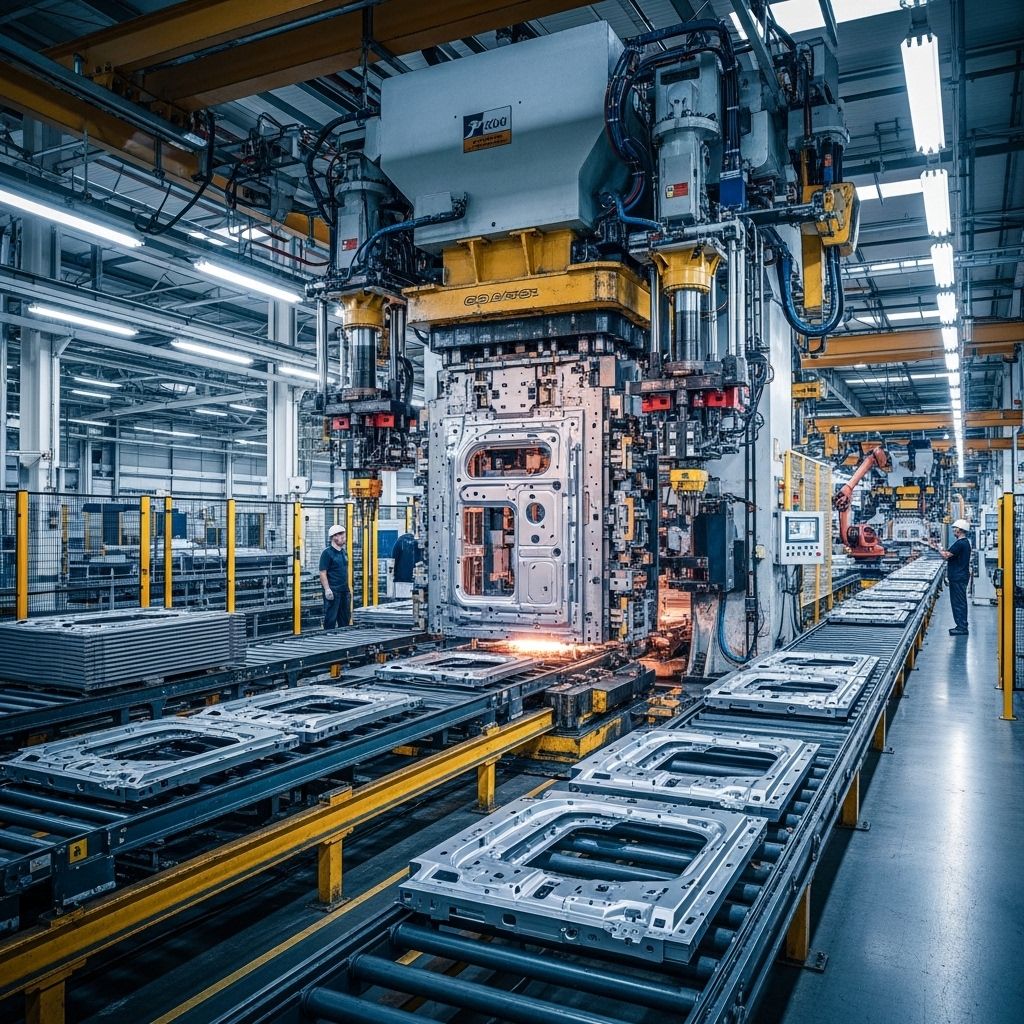
Automotive sheet metal structures contain numerous geometric discontinuities by necessity: spot weld nuggets, access holes, embossed stiffening ribs, and press-formed edges all act as stress concentrators. At a circular hole in a wide plate under uniaxial tension, Kt = 3 — meaning the stress at the hole boundary is three times the remote applied stress. At sharp re-entrant corners, Kt values may exceed 5 or more, depending on the notch geometry. These elevated local stresses are the primary initiation sites for fatigue cracks under cyclic loading — a critical consideration in the design of automotive structural components subjected to road-induced vibration over their service lives.
The Geometry of Plastic Deformation Zones
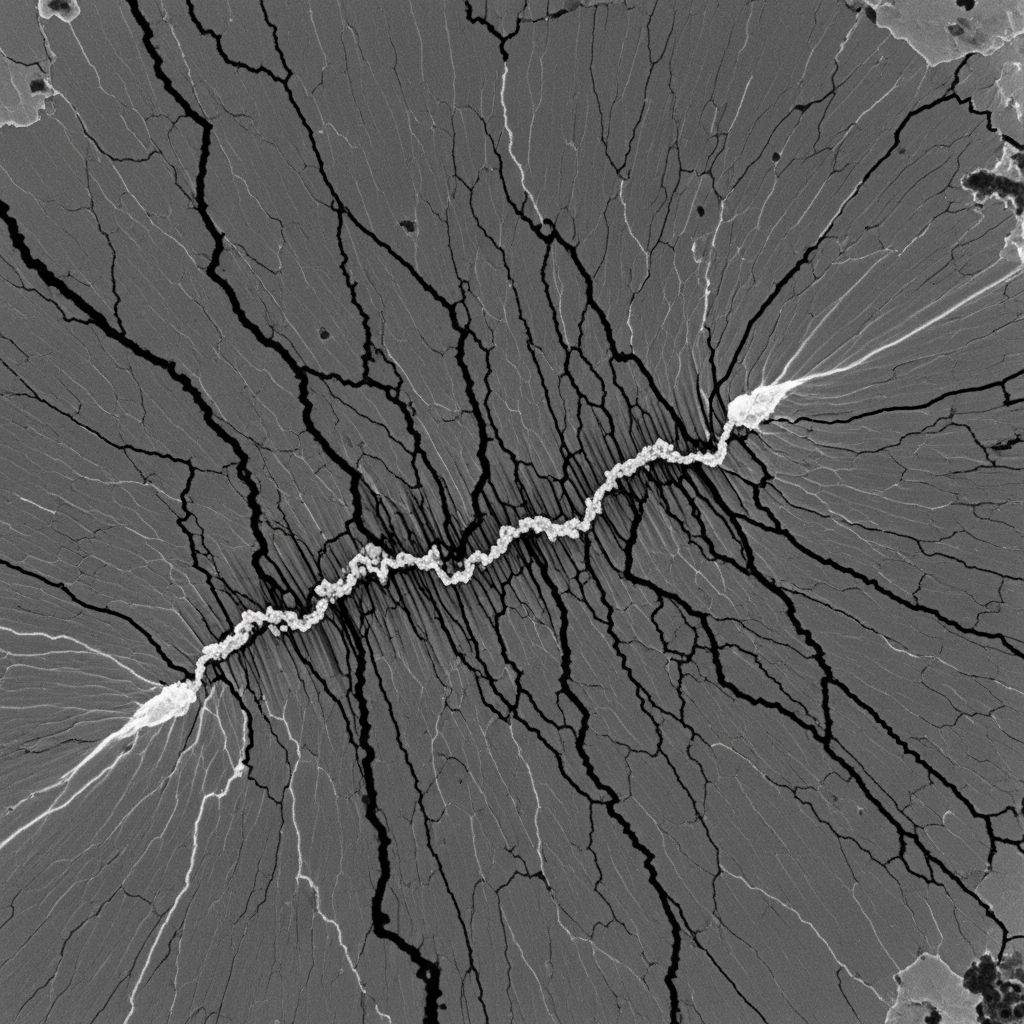
When a concentrated load is applied to a sheet metal panel — through the point contact of a rigid indenter, for example — the resulting deformation does not propagate uniformly through the material. Instead, the plastic deformation zone takes a characteristic geometry determined by the yield criterion of the material, the thickness and curvature of the sheet, and the contact geometry of the loading body.
For a rigid spherical indenter contacting a flat plate, the initial elastic contact stress field follows the Hertzian contact distribution: a hemispherical pressure distribution beneath the contact zone with maximum pressure at the contact centre. As the load increases, yielding first initiates at a depth of approximately 0.47 times the contact radius beneath the surface — not at the surface itself — because the maximum shear stress is subsurface for this loading geometry. As plastic deformation grows, the plastic zone expands upward to reach the surface and outward radially, constrained by the surrounding elastic material.
The extent of the plastic zone and the depth of permanent surface deflection are functions of the sheet thickness, the yield strength of the material, and the load magnitude relative to the material's full plastic moment (the moment at which the entire thickness has yielded). Thin-gauge materials yield through the full thickness at lower absolute loads, producing permanent surface deformation that is characteristic of the substrate geometry around the loading point. The surrounding elastically loaded region constrains this permanent deformation, generating a compressive residual stress field in the panel skin around the deformation perimeter — a feature that can be observed through electronic speckle pattern interferometry (ESPI) in laboratory conditions.
Strain Hardening and Its Role in Deformation Propagation
As established in the discussion of molecular memory, metallic materials exhibit strain hardening — the progressive increase in flow stress as plastic strain accumulates. In the context of deformation under a concentrated load, strain hardening plays a critical role in determining the spatial extent and depth of the plastic zone.
The flow stress σf of a strain-hardening material is described by the Hollomon power law: σf = Kεn, where K is the strength coefficient, ε is the true plastic strain, and n is the strain-hardening exponent. For mild steel, n typically ranges from 0.20 to 0.26; for aluminium alloy 6061-T6, n is considerably lower at approximately 0.07, indicating that aluminium hardens less rapidly with strain than mild steel. This lower work-hardening rate means that once yielding initiates in aluminium, the plastic zone expands more rapidly and with less resistance than in equivalent steel, producing wider, shallower deformation profiles for the same applied energy.
The strain-hardening exponent n is not merely a constitutive parameter: it is directly related to the material's uniform elongation in a tensile test (the Considère criterion establishes that necking initiates when ε = n). Higher n values therefore indicate better formability in stretch-forming operations, explaining why automotive manufacturers specify minimum n values for outer skin panel steels where deep-drawing formability is required.
Anisotropy and Its Influence on Deformation Direction
Cold-rolled automotive sheet metals are not isotropic: their mechanical properties vary with direction relative to the rolling direction of the strip. This anisotropy arises from the preferential crystallographic texture that develops during rolling, in which grain orientations are not random but distributed according to specific texture components (Goss, cube, copper, brass) depending on the degree and temperature of rolling.
The normal anisotropy ratio r (Lankford coefficient), defined as the ratio of width strain to thickness strain in a uniaxial tensile test, quantifies the material's resistance to thinning relative to in-plane straining. High r values (r > 1) indicate that the material preferentially strains in-plane rather than thinning — a desirable property for deep-drawing operations where through-thickness thinning and fracture must be avoided. Modern automotive deep-drawing steels are engineered to achieve r values of 1.4–2.2 through texture control in the rolling and annealing process.
Planar anisotropy — the variation of r with angle to the rolling direction — causes earing during deep drawing, in which the rim of a drawn cup develops a series of lobes corresponding to the crystallographic texture peaks. This geometrically undesirable effect must be managed through blank design and die geometry optimisation in production forming operations.
Explore how these structural physics principles have shaped the evolution of vehicle panel manufacturing over more than a century of industrial development.